
User Guide
The dashboard
The dashboard is the first screen in ArkCloud RCM. Its layout is fixed - there are no widgets to add, move or configure - and this page describes what is on it.
Written for: Collectors · Supervisors
What is on the dashboard
ArkCloud RCM → My Work → Dashboard
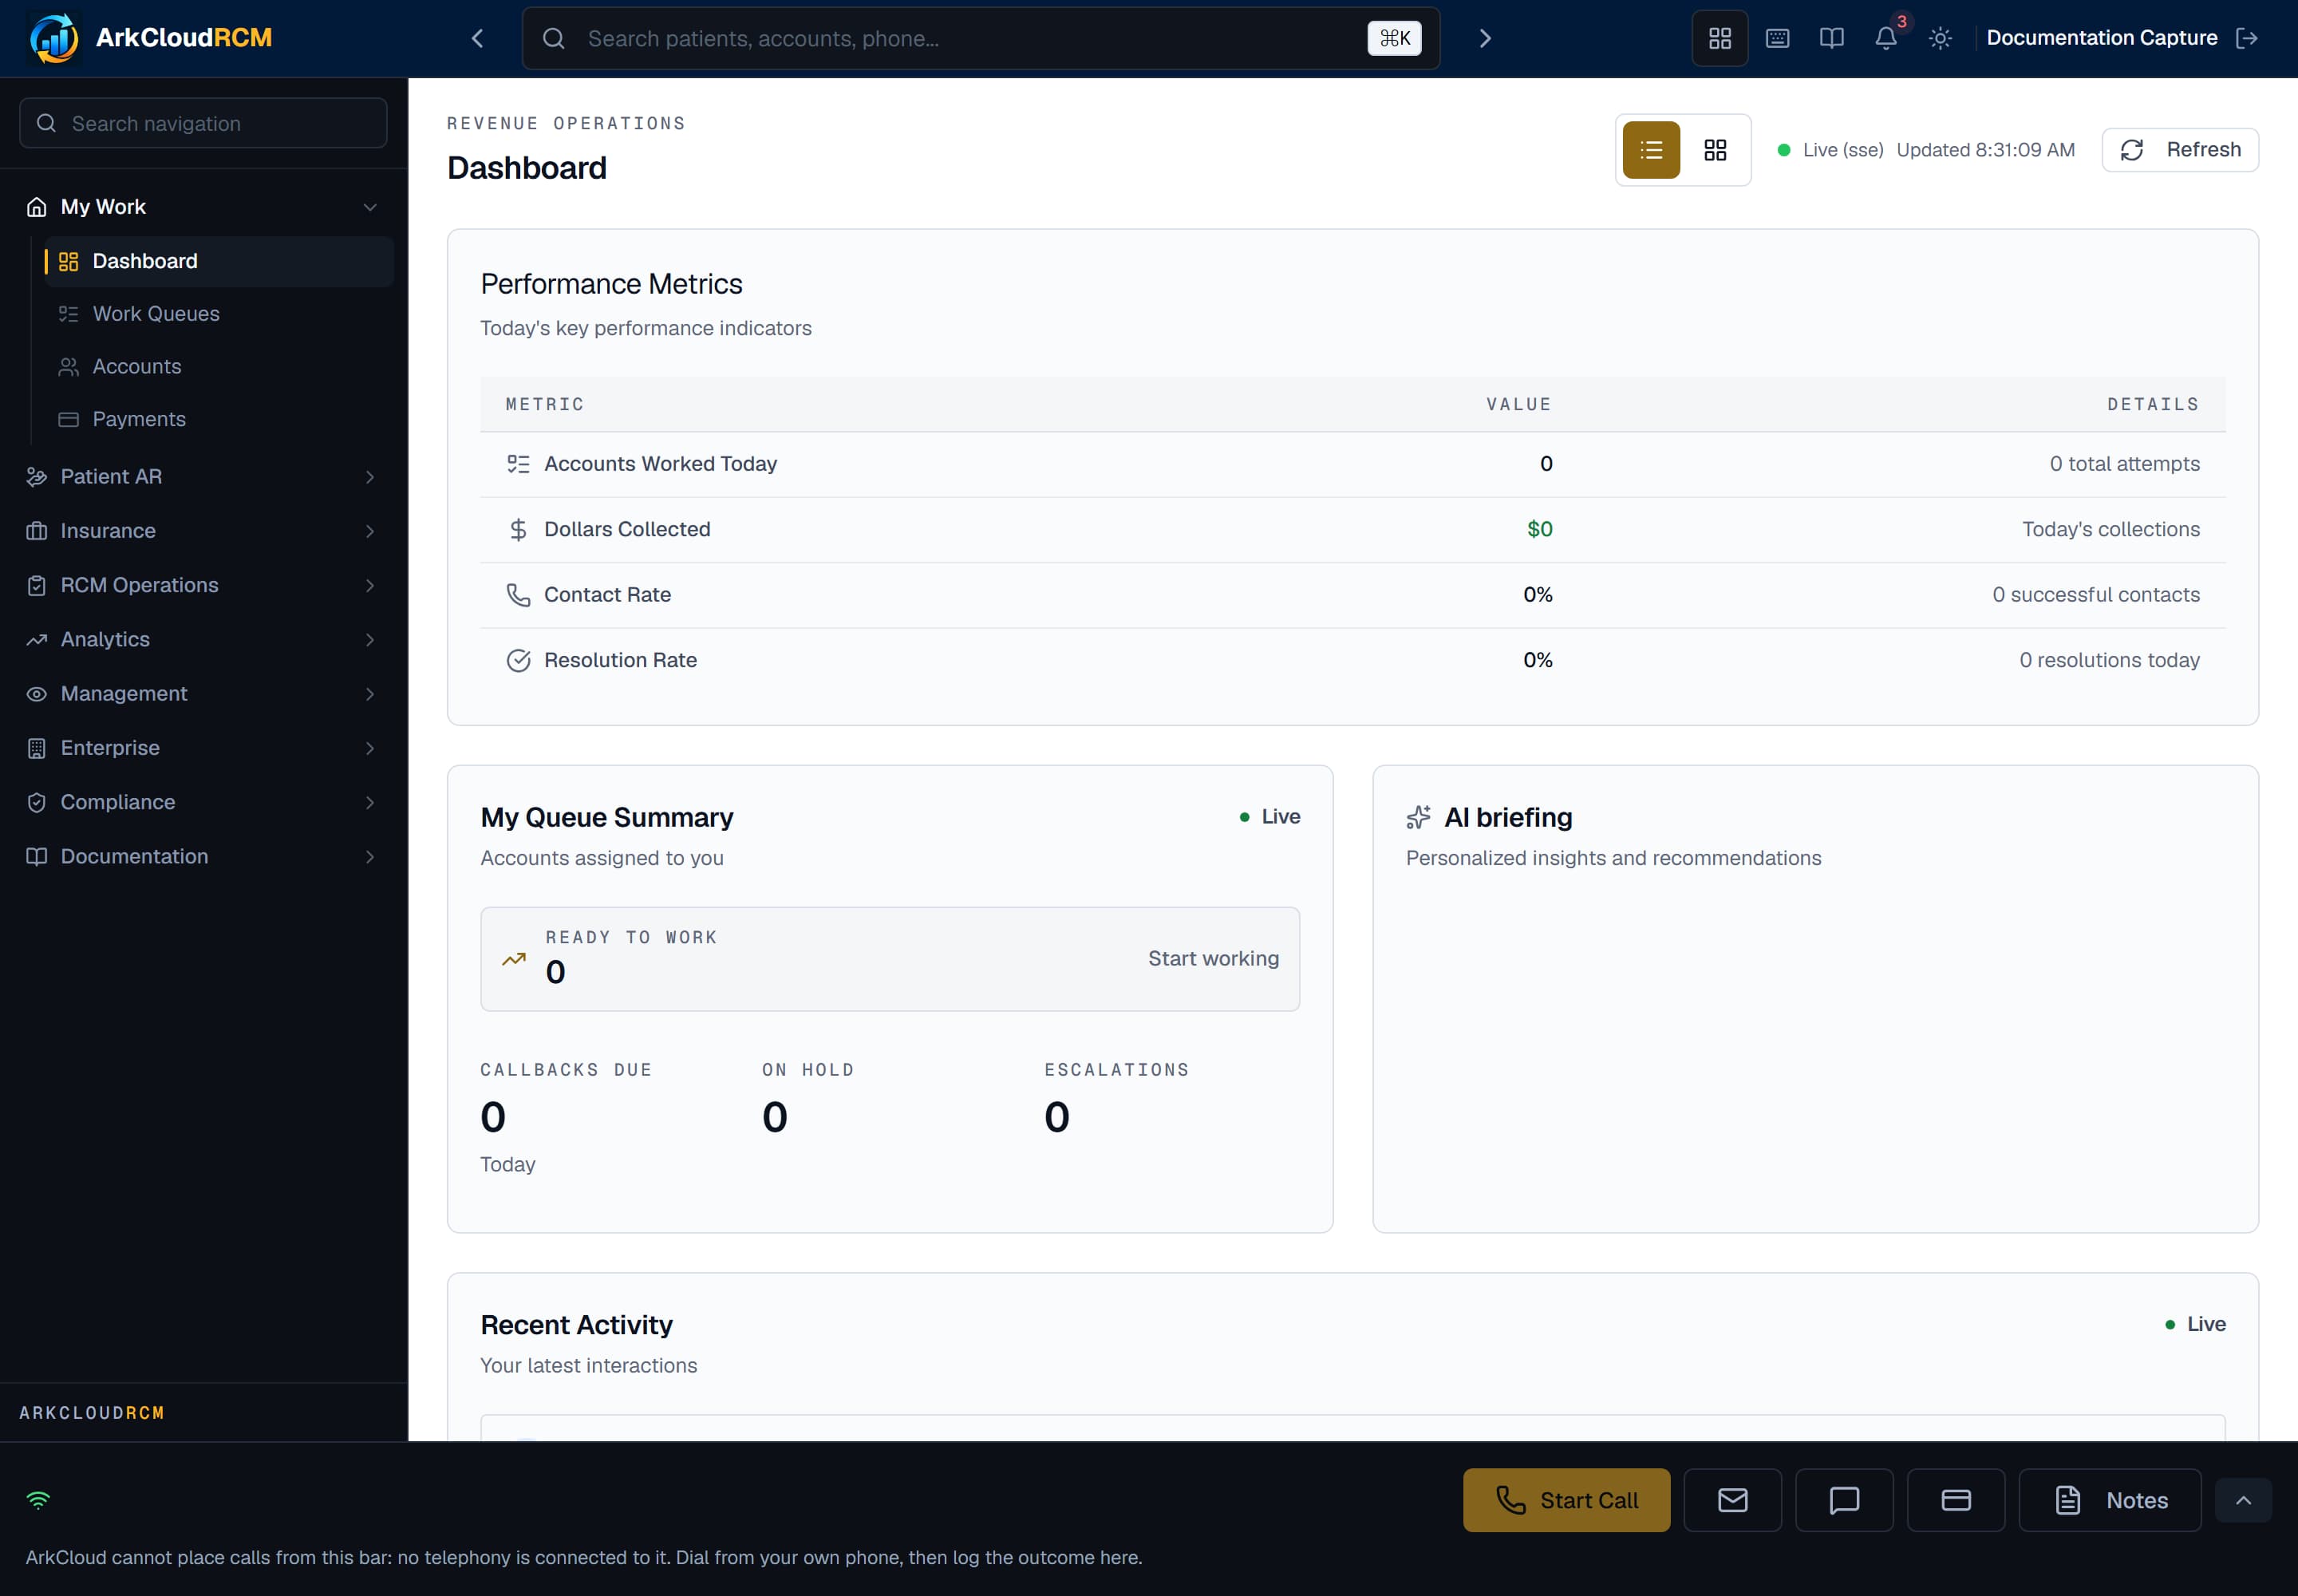
The dashboard: four metrics across the top, then your queue summary, the briefing and recent activity.
/dashboard
| Field or control | What it means |
|---|---|
| Metrics | Accounts Worked Today, Dollars Collected, Contact Rate and Resolution Rate. |
| My Queue Summary | Ready to work (opens Work Queues), Callbacks due, On hold and Escalations. |
| Briefing | High-value accounts (each opens the account) and the trend in denied claims. Worked out from fixed rules over your data, not by a model. |
| Recent Activity | The last five interactions recorded. |
Customising
The dashboard cannot be customised: there is no way to add, remove, move or resize a panel, and no saved layouts or templates. The only controls are Refresh and a card/list view toggle, which your browser remembers. For other views, use the separate dashboards listed under reports.
How it refreshes
When the live connection is up, a Live badge shows. Without it, the metrics refresh every few seconds on their own.
On a phone
The panels stack into a single column. See mobile access.