
Analytics
Denial analytics
A breakdown of the claims payers denied, by month, category and payer, counted from the claims and remittances recorded in ArkCloud. It describes what happened; it does not predict denials.
Written for: Denial management staff · Revenue cycle managers
Opening the screen
Sidebar → Insurance → Denials → Analytics
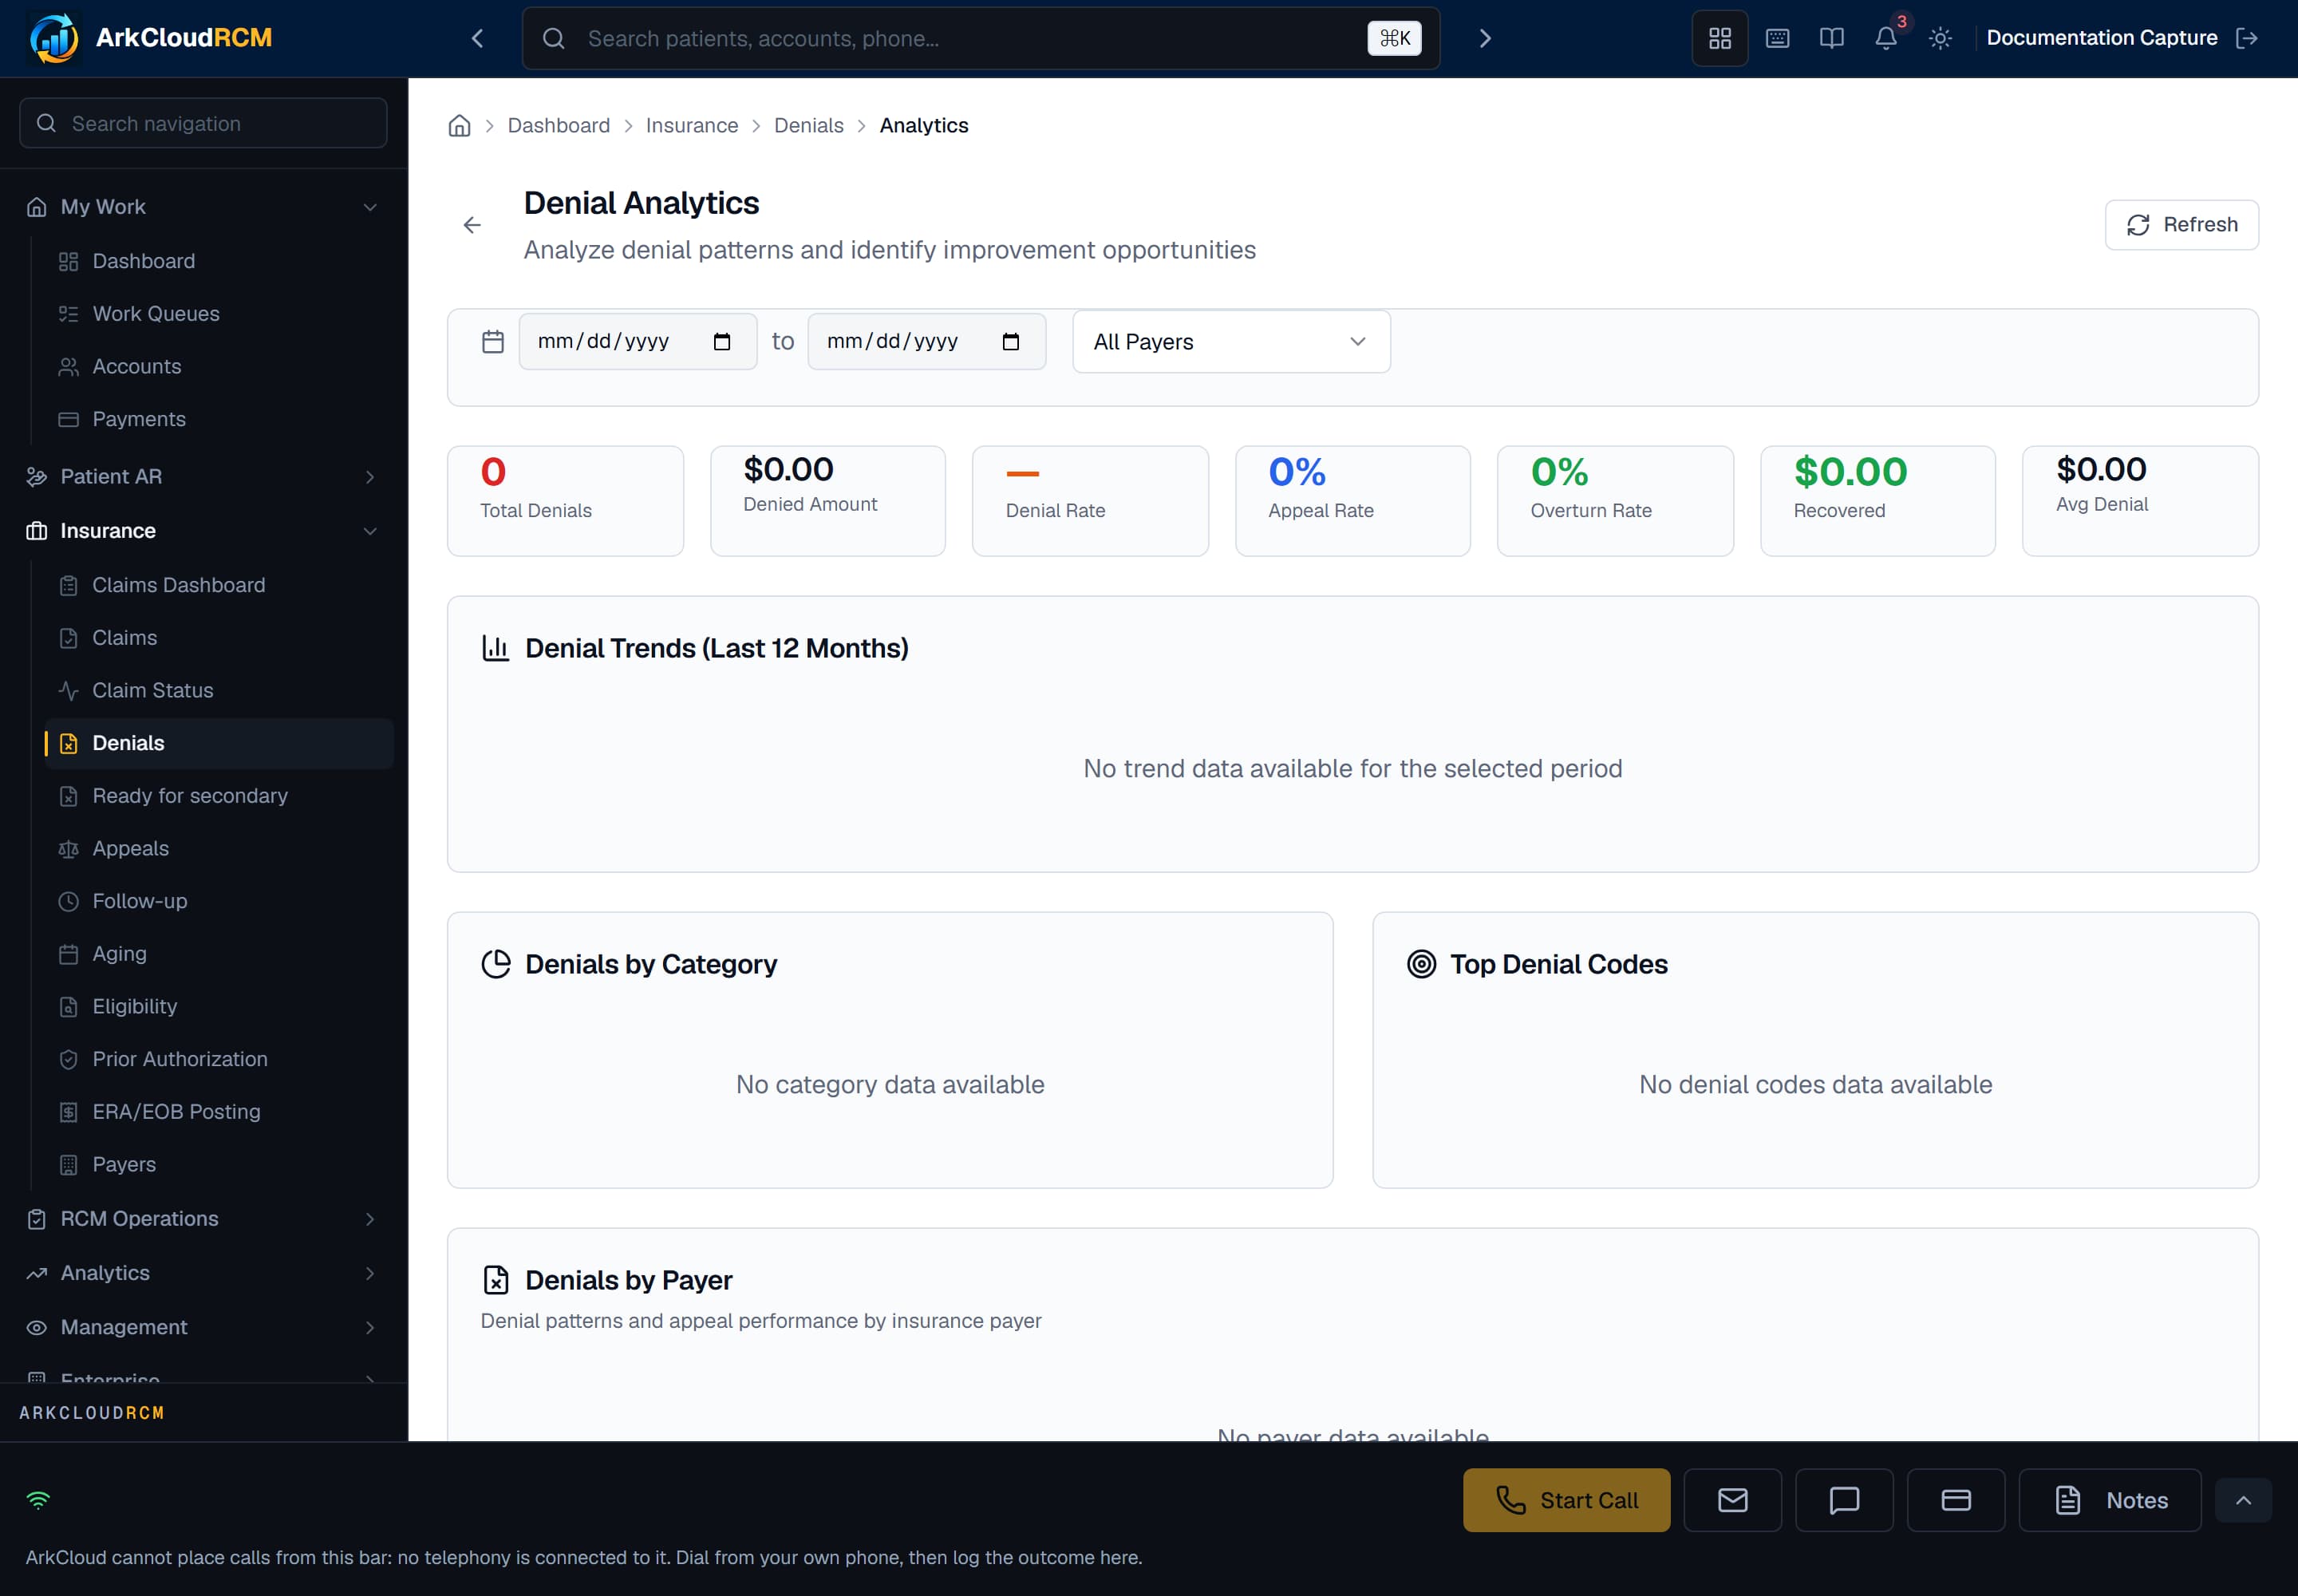
Denial analytics in an organisation with no adjudicated claims yet. Figures appear once remittances have recorded denials.
Empty state. Captured in a demonstration organisation with no records of this type yet. The controls, columns and filters are the ones a populated screen uses.
/dashboard/insurance/denials/analytics
- Open Denials and choose the analytics button.
- Set the date range (by adjudication date) and, optionally, a payer.
What it shows
| Field or control | What it means |
|---|---|
| Monthly trend | Denials and denied amount per month, with the share appealed and the share of appeals overturned. |
| By category | Coding error, missing documentation, authorization required, non-covered, duplicate claim, other. |
| By payer | Denials and amounts per payer. |
| Denial rate | Claims denied ÷ claims adjudicated (paid, partly paid, denied or under appeal), the same definition used on every screen. |
Not available
There is no denial prediction or risk scoring - the claim scrubber checks claims against fixed rules before submission, which is a different thing (see claims). There is no root-cause analysis, no recovery-opportunity report, and no comparison with other organisations. ArkCloud Insights has a separate, read-only denial view (Insights) built from the same remittance data.
Using it well
- Look at categories with a high count and a low overturn rate first - they are usually front-end process problems (eligibility, authorization, registration).
- Compare payers on the same category before concluding a payer is the problem.
- Review monthly so a change in a payer's behaviour is caught within one cycle.