
Documentation
ArkCloud Insights
Reporting across the ArkCloud products your organisation holds: an executive roll-up, per-product analytics, and an exportable activity report.
Insights is a reader, not a source. It owns no clinical or financial records. Every figure is a count of your organisation's records in ArkCloud RCM, Rehab, Workforce, Clinical, Access or Care, read under the same tenant isolation those products use. Insights counts all six whether or not your organisation subscribes to them, so a product you do not use normally shows as having no data rather than being left out.
Who can open it. Supervisor, Admin and Super Admin accounts; the Administration page is limited to Admin and Super Admin. The product is off until a platform operator enables it for the deployment; while it is off, the launcher refuses entry. Agents and client-portal users cannot open it.
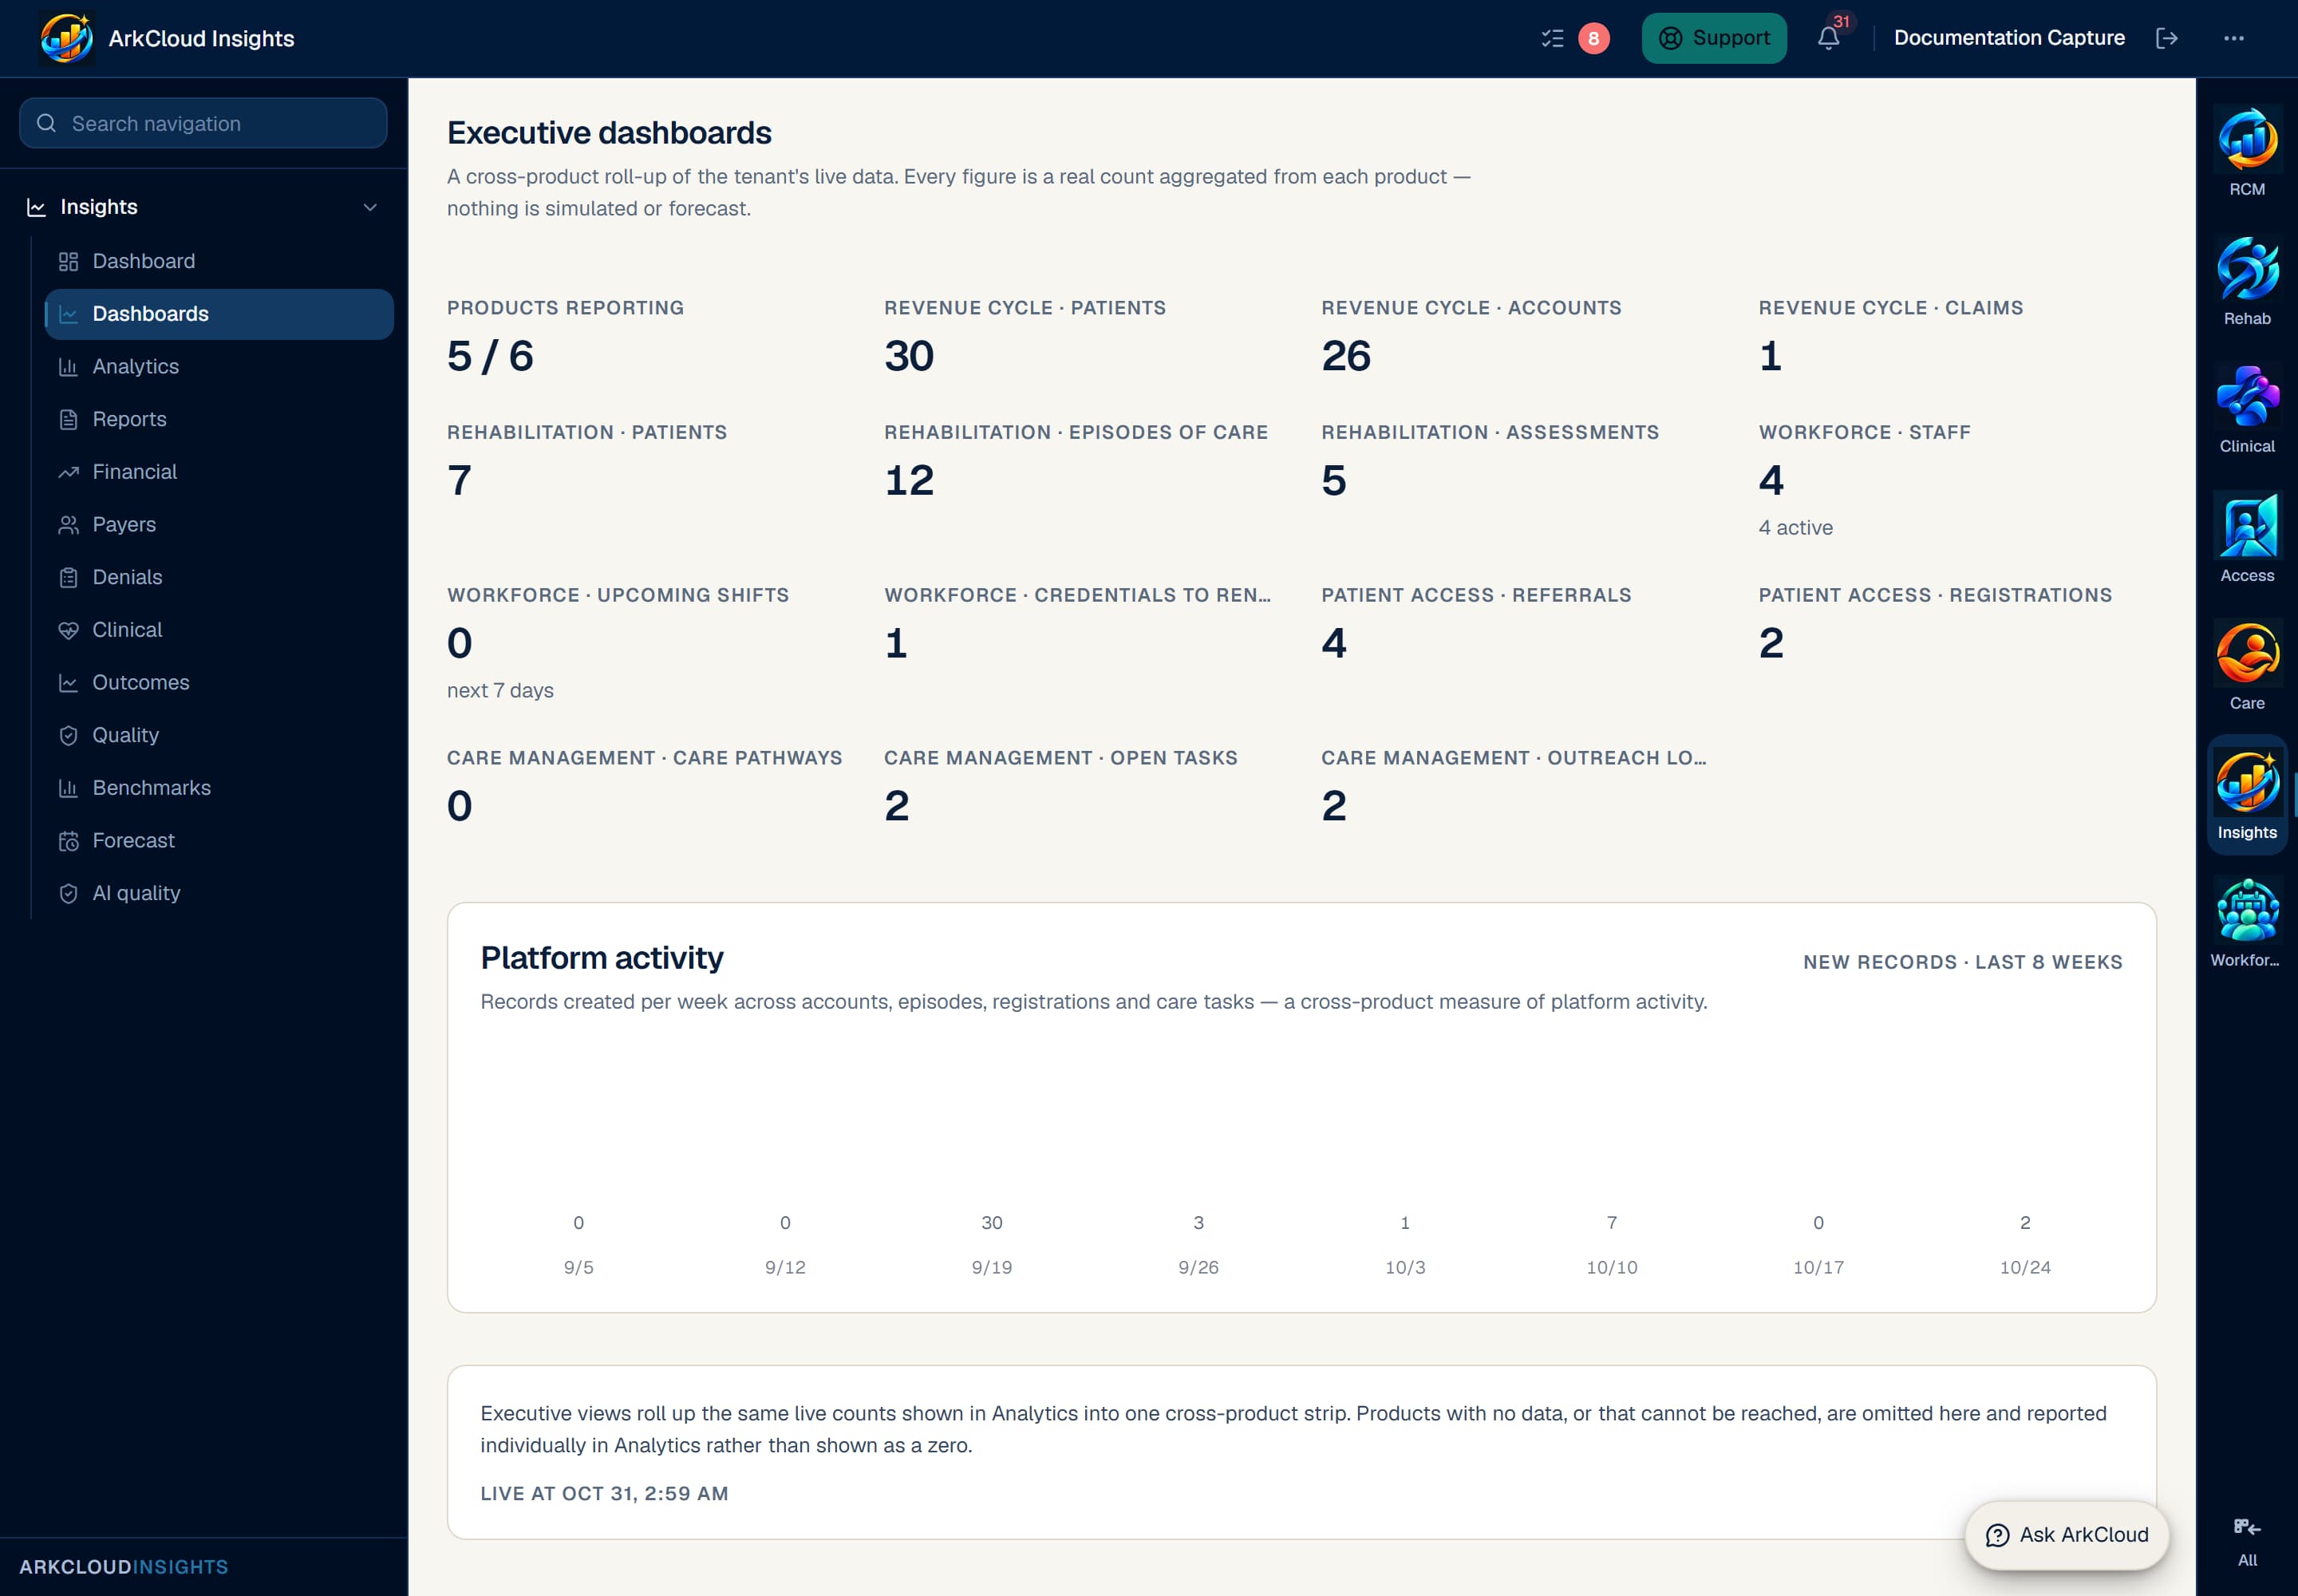
Executive dashboards roll activity up across every ArkCloud product the organisation has records in, with a weekly trend of records created. Everything shown aggregates existing records; nothing is modelled or projected.
/insights/dashboards
What the numbers are, and are not
- Your tenant's own data. A roll-up spans your organisation's records - not other customers, and not an industry average rendered as though it were yours.
- Derived, not stored. A figure is computed from the records that own it, so a report cannot quietly disagree with the ledger behind it.
- Empty where there is nothing. On the Dashboard and Analytics, a product with no records says so on its card, and one that could not be read says it is unavailable. The executive strip leaves both out rather than showing a zero, because a missing figure and a zero mean different things to someone reading a dashboard.
Executive roll-up
One view across the products your organisation holds. It aggregates your own tenant's records - never another customer's, and never an industry average presented as yours.
Per-product analytics
Record counts per product and a weekly count of records created, plus financial, payer, denial, clinical, outcome, quality and forecast views for a chosen period - each read from the product that owns the records rather than from a separate reporting copy. Outcome improvement needs published outcome measures (none are published by default), and there are no eCQM, HEDIS or MIPS measures.
Derived on read
Figures are computed when you ask for them. Nothing is precomputed into a reporting table that could disagree with the ledger it came from.
Exportable activity report
The activity report can be printed or exported as CSV, stamped with the time it was generated so a saved copy cannot be mistaken for a current one. It holds point-in-time counts; there is no date-range filter.
Built and working today
Read from the application's own capability registry, so this list cannot claim something the code has not built.
- Executive dashboards
- Operational analytics
- Financial analytics
- Clinical analytics
- Rehabilitation outcomes· needs published outcome measures before it reports any change in score
- Payer performance
- Denial analytics
- Utilization trends
- Quality metrics
- Benchmarking
- Forecasting
- Configurable reporting
- Cross-product analytics
- AI quality and usage