
ArkCloud Insights
Dashboards
A cross-product roll-up of what your organisation has actually recorded. Everything here aggregates existing data; nothing is estimated, modelled or inferred.
Written for: Operations leadership · Executives · Evaluators
Executive dashboards
Launcher → ArkCloud Insights → Dashboards
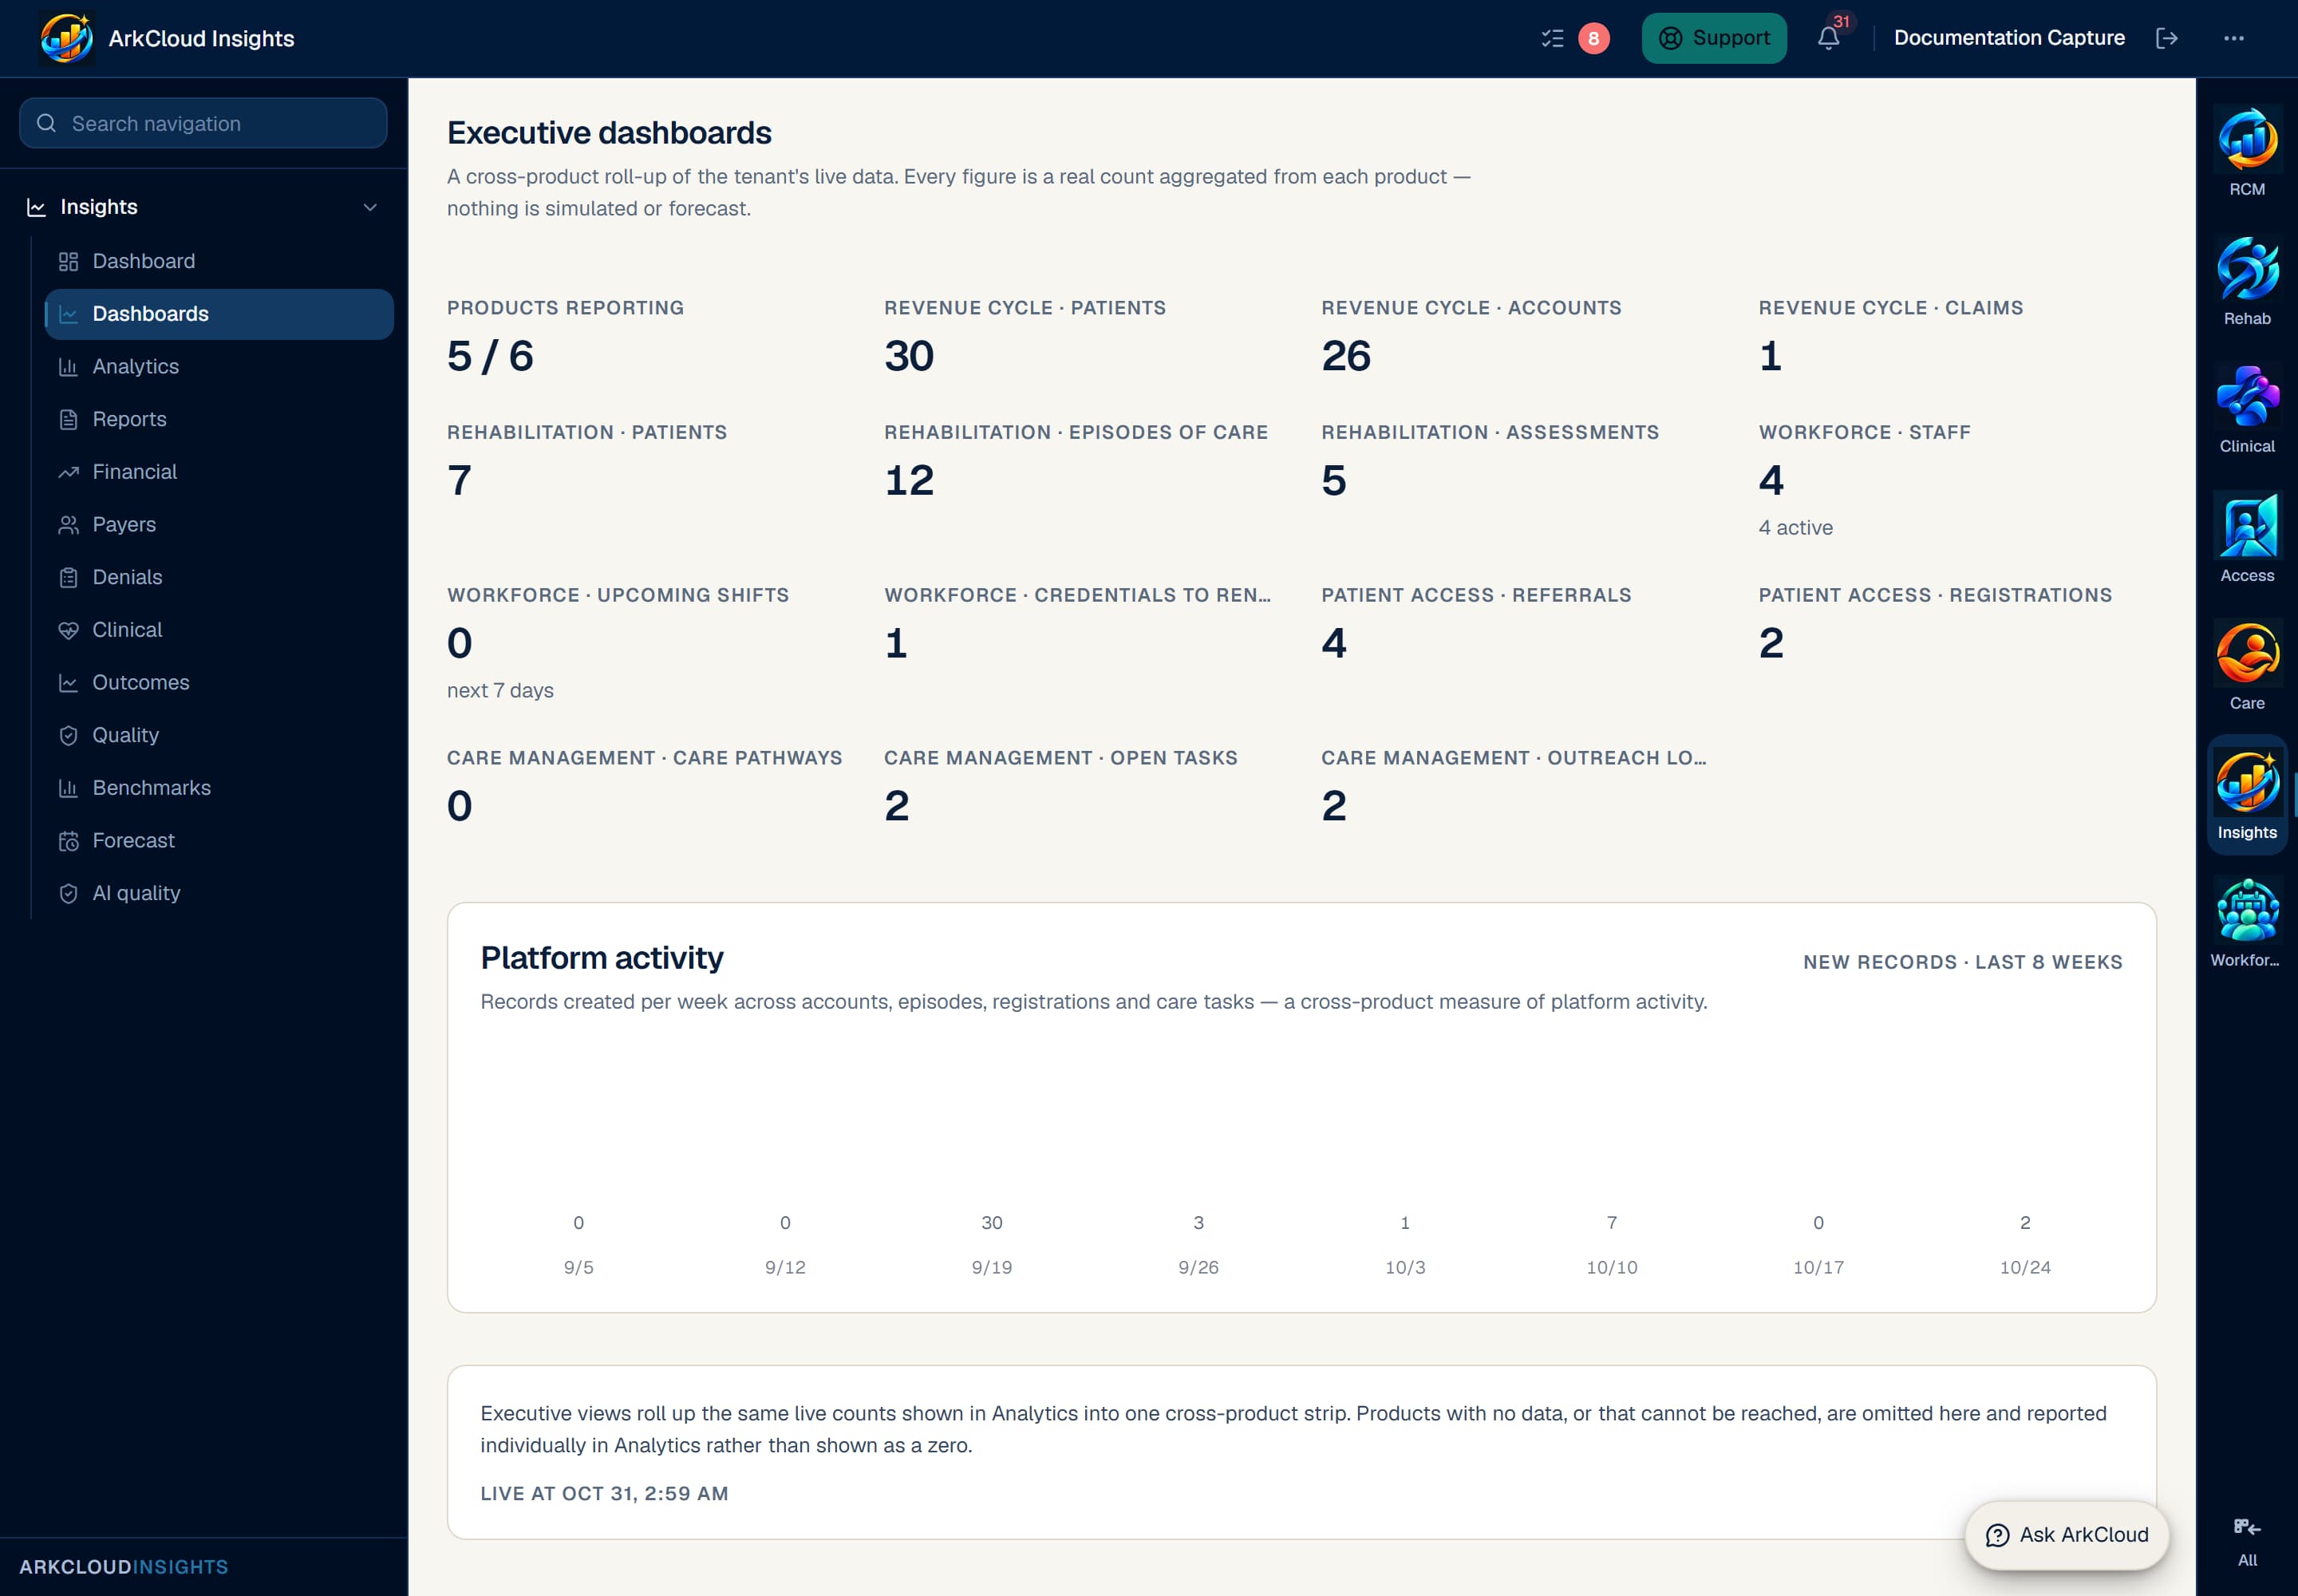
The executive roll-up spans every ArkCloud product the organisation uses, which is the one view no individual product can produce.
/insights/dashboards
The per-product overview is the Dashboard; the breakdown within a product is Analytics. The distinction is scope, not depth.
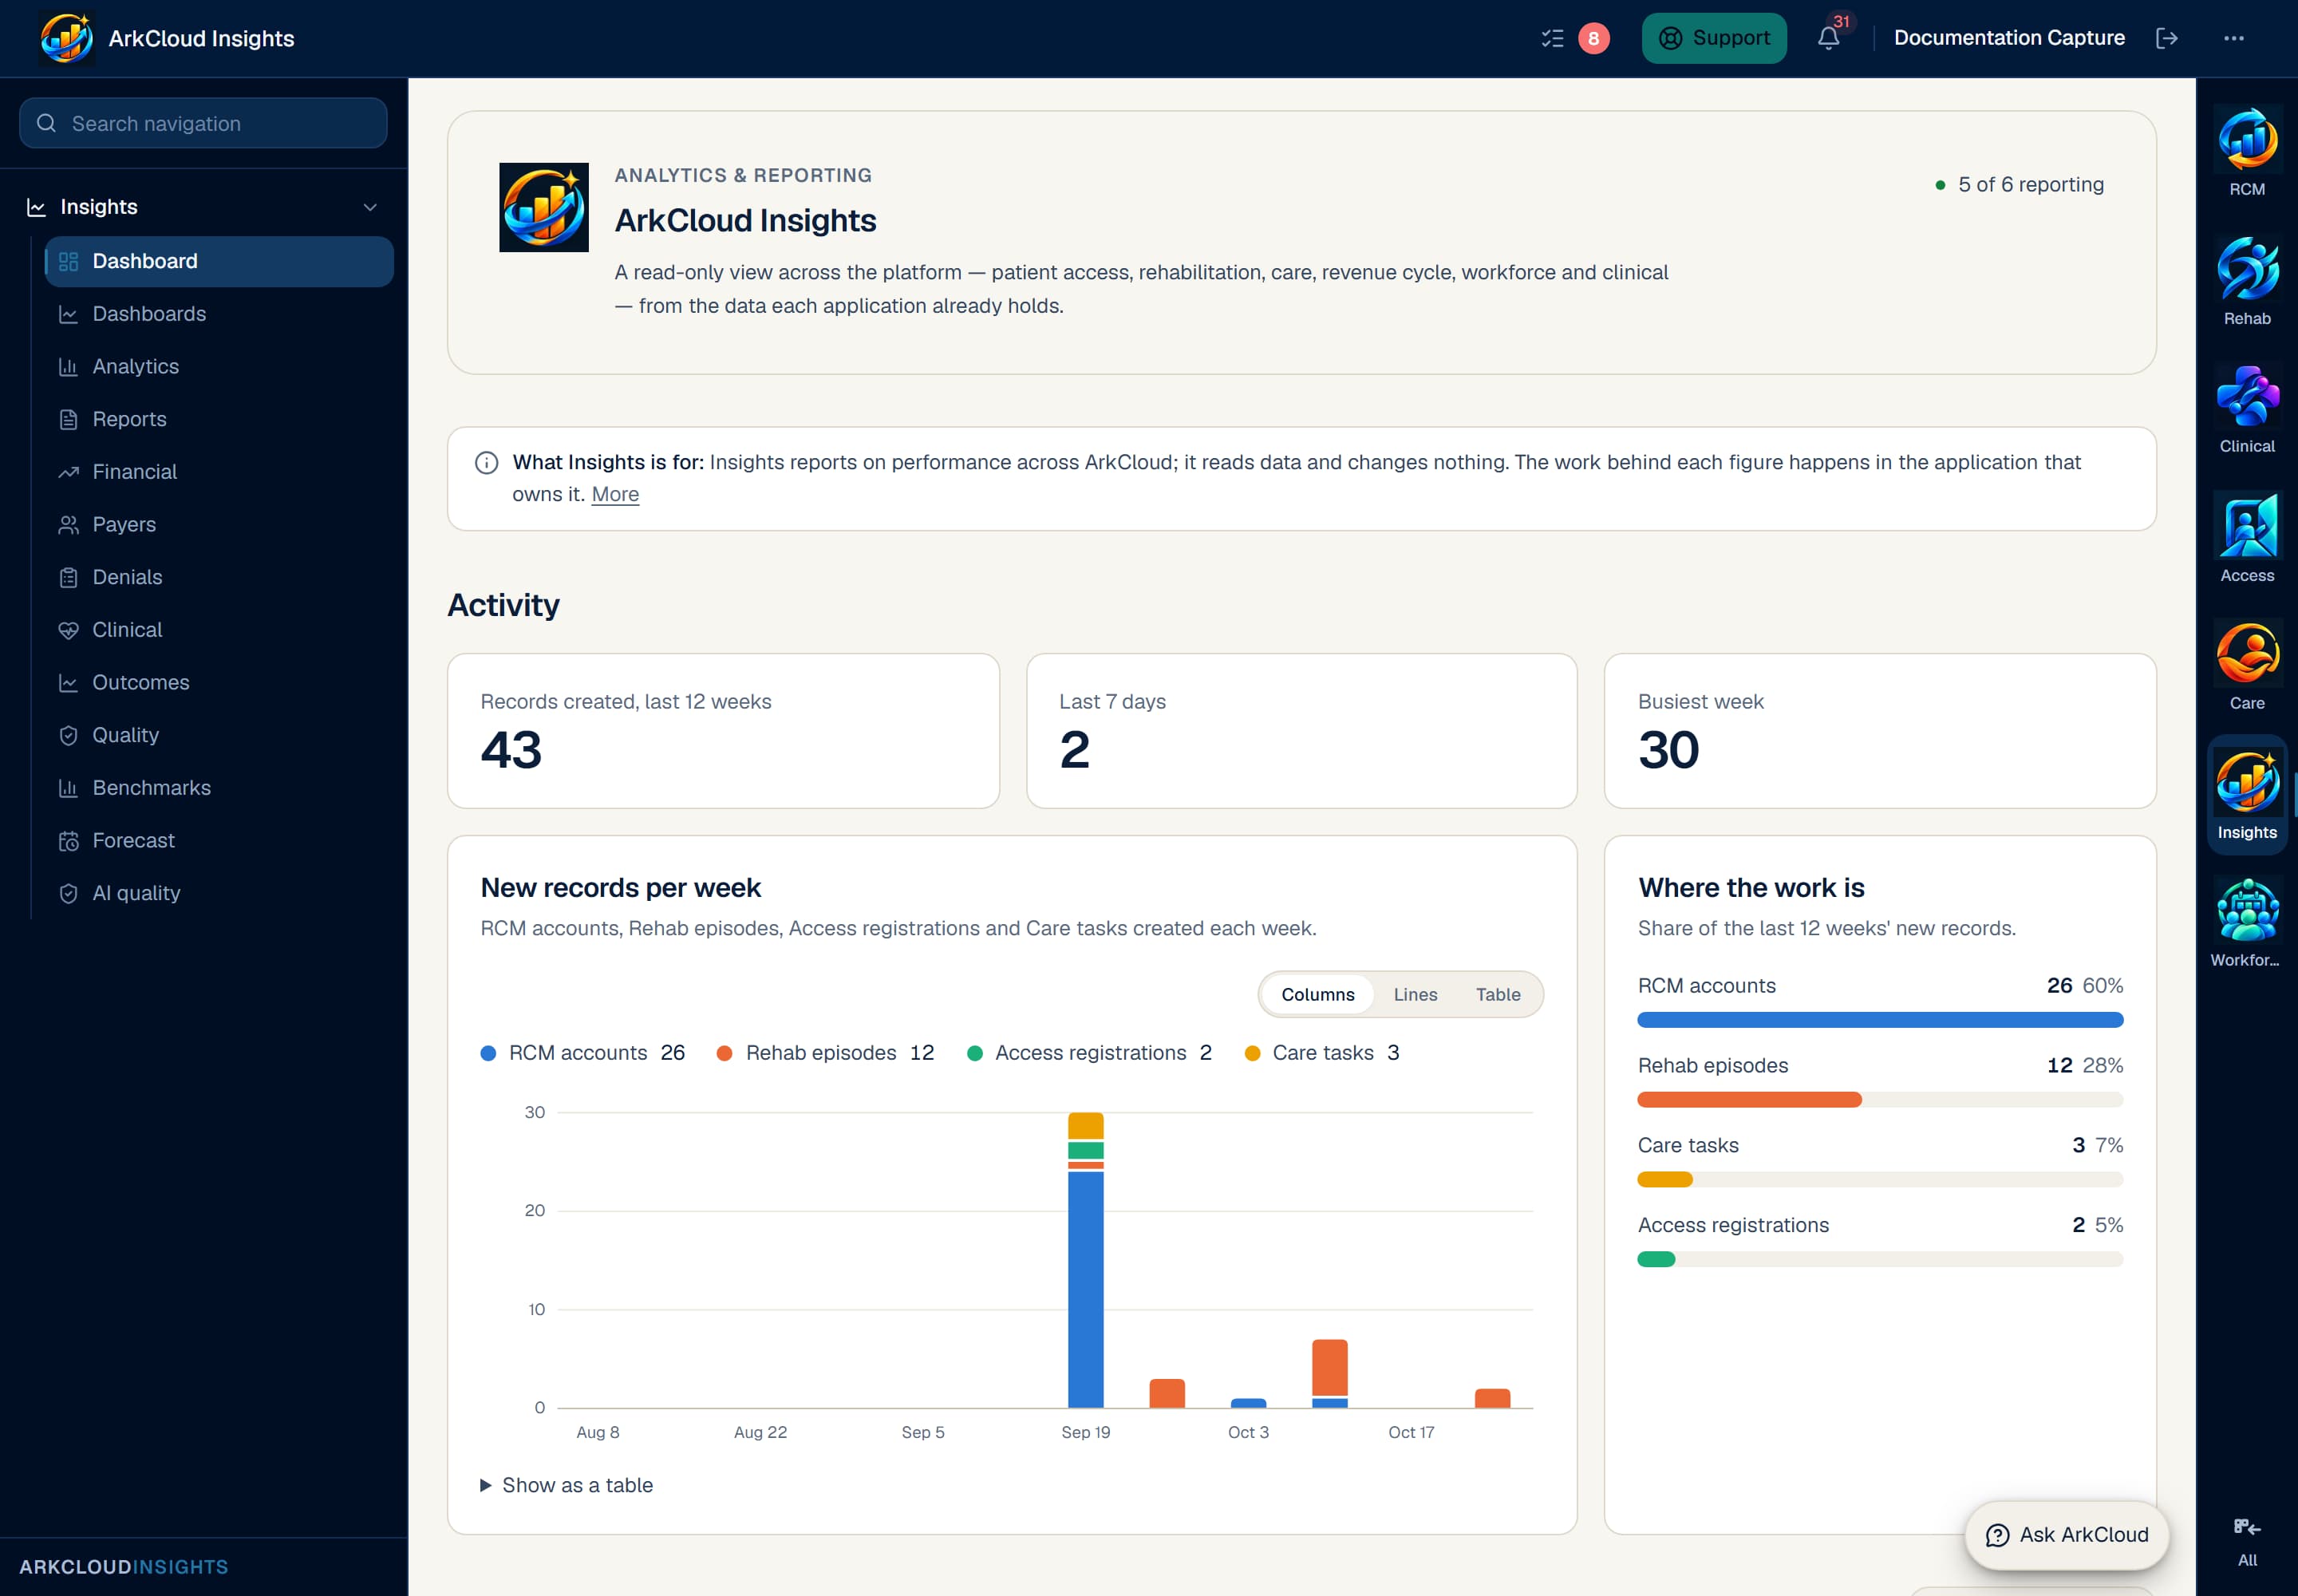
The per-product overview, shown in an organisation with little recorded activity. An organisation with no data in a product sees an honest empty state rather than a zeroed chart.
Empty state. Captured in a demonstration organisation with no records of this type yet. The controls, columns and filters are the ones a populated screen uses.
/insights/dashboard
What is aggregated
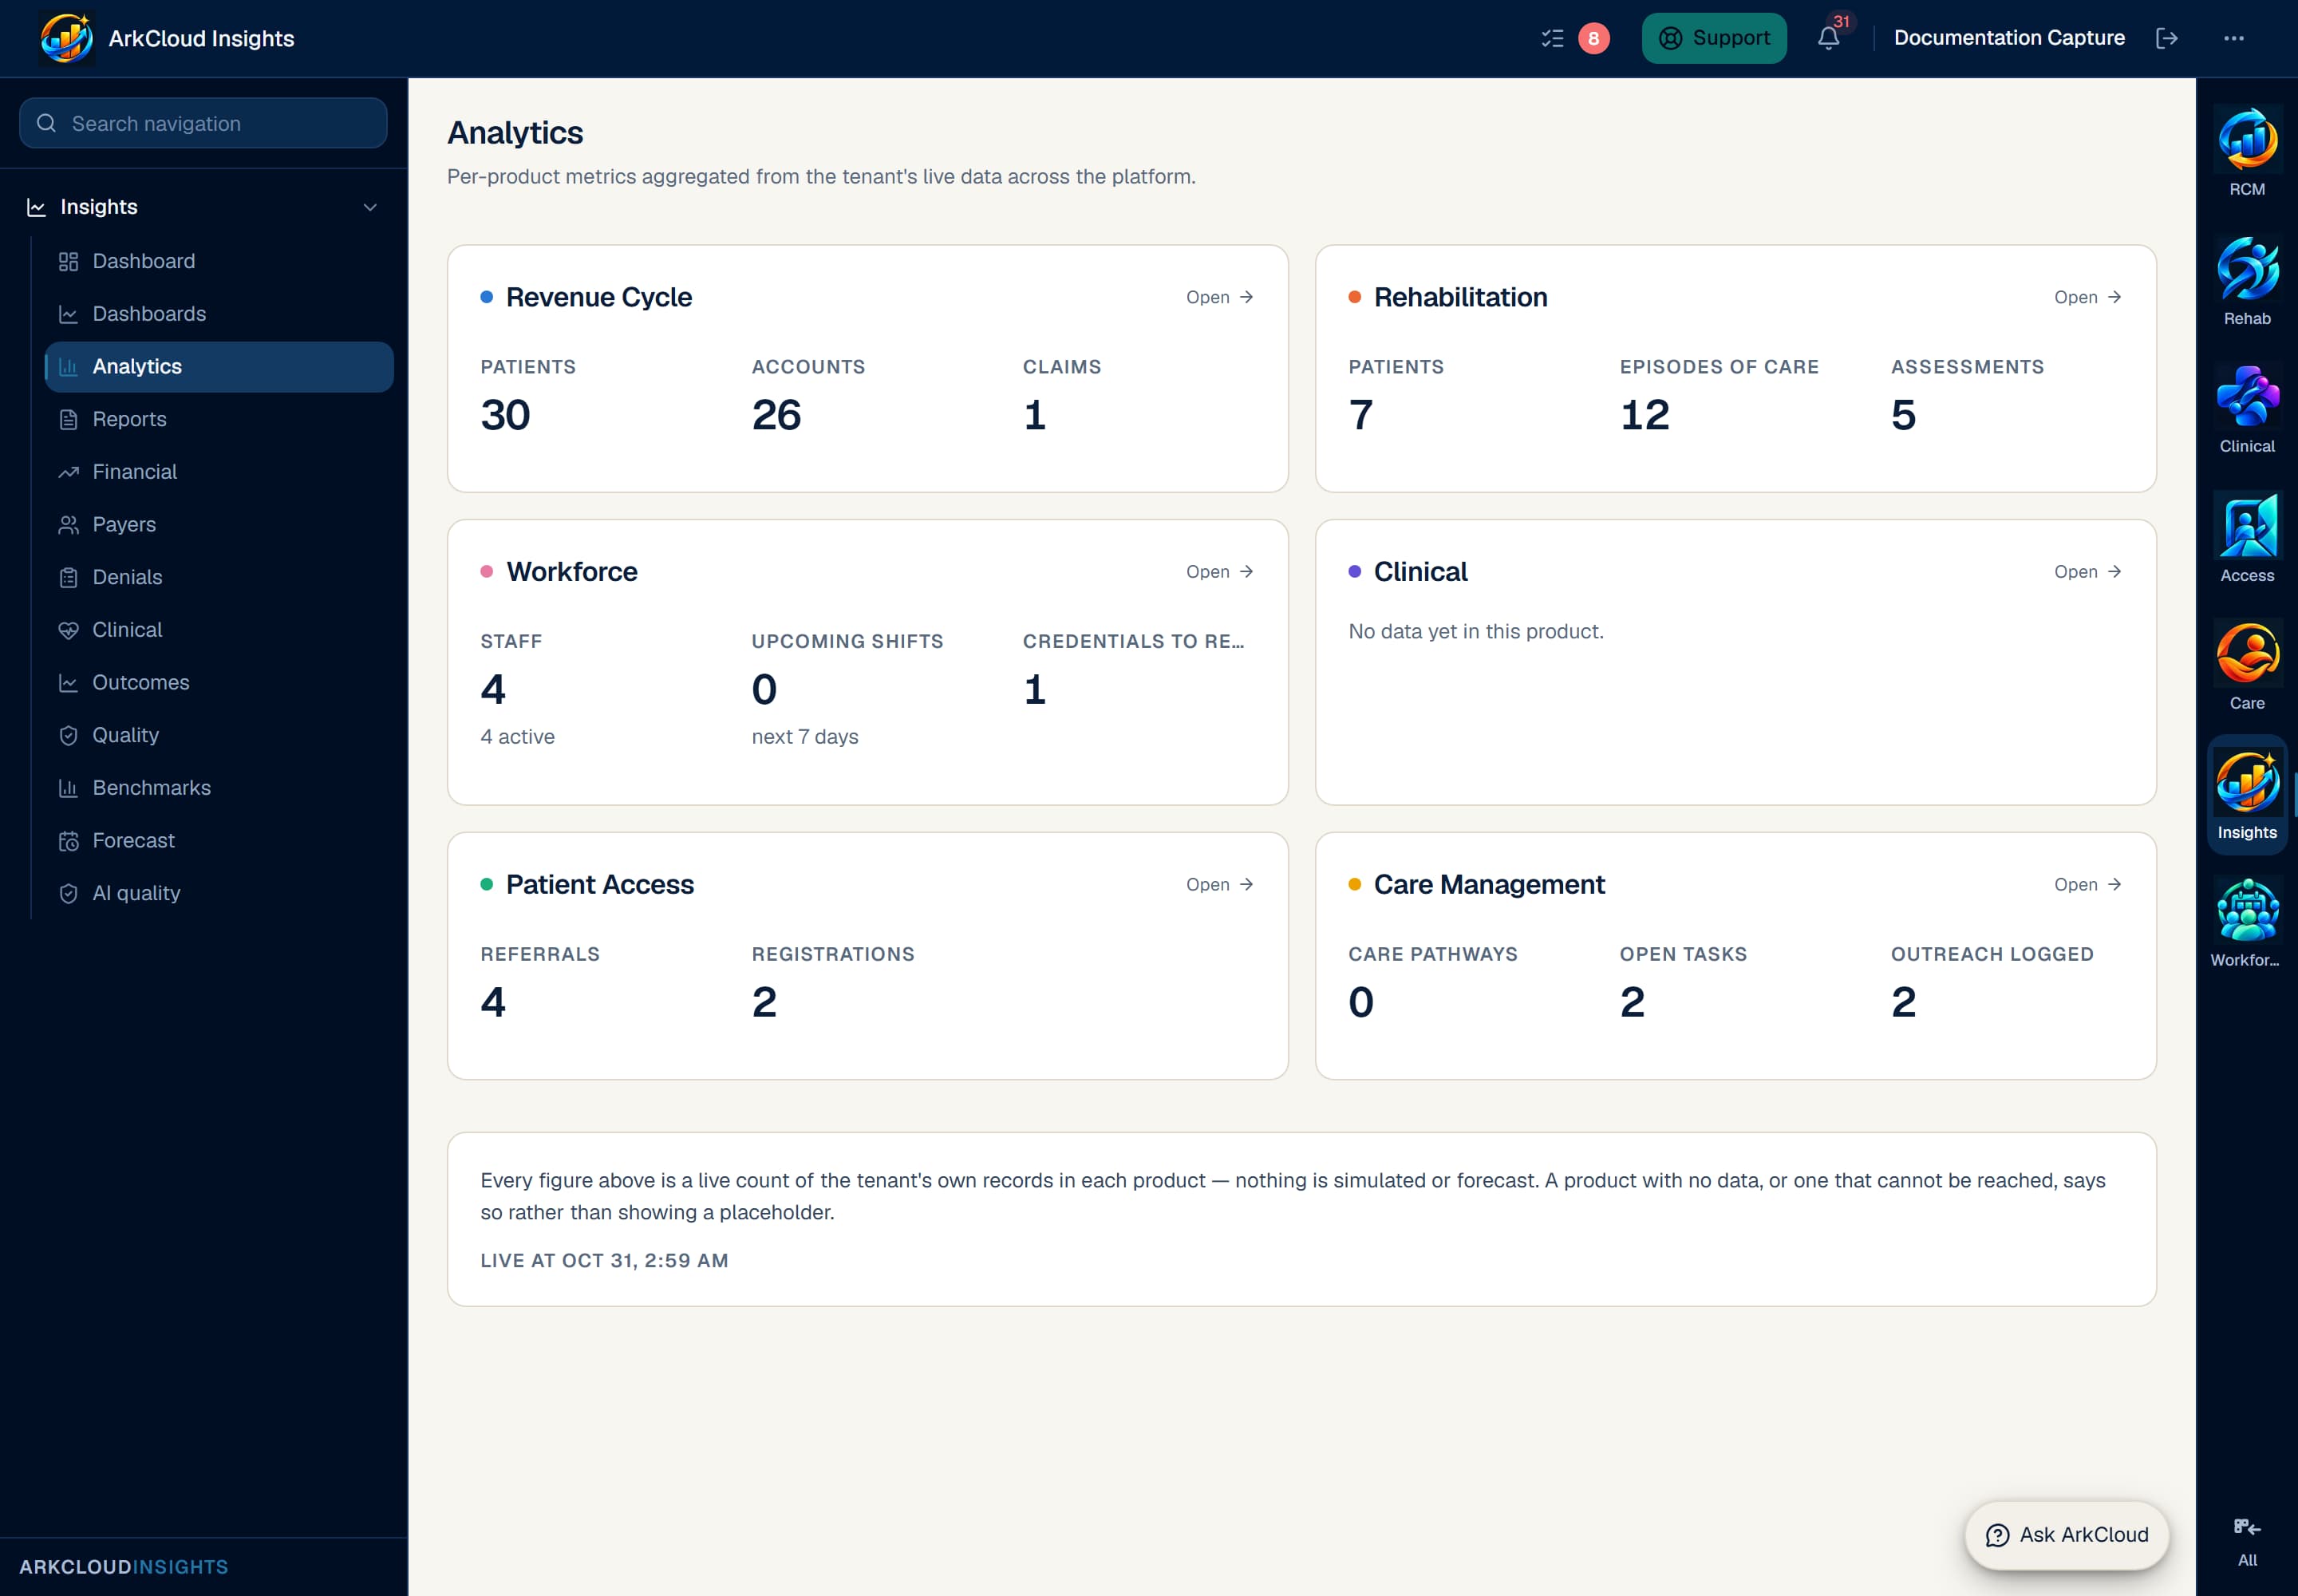
Analytics breaks activity down within a product. It reads the organisation's own records - it does not estimate, benchmark against other organisations, or project forward.
Empty state. Captured in a demonstration organisation with no records of this type yet. The controls, columns and filters are the ones a populated screen uses.
/insights/analytics
Two capabilities that are narrower than their names
Two things are marked as built and are built only to a specific scope. Both are worth knowing before an evaluation, because the names invite a broader reading.
| Field or control | What it means |
|---|---|
| Configurable reporting | One report type: choose which products to include, then print or export CSV. No date-range filter. Saved reports, scheduled reports and custom metric selection are not implemented. |
| Utilization trends | Operational activity volume - records created per week across products, over the last eight weeks, on the Dashboards page. A product that could not be read is named and left out of the counts. Clinical service-utilization measures such as bed-days, visit counts and procedure utilization are a regulated analytics domain and are not implemented. |
The analytics screens, and their limits
Since 3 October 2026 Insights also has eight analytics screens, each with a period selector (last 30 days, 90 days or 12 months): Financial, Payers, Denials, Clinical, Outcomes, Quality, Benchmarks and Forecast.
| Field or control | What it means |
|---|---|
| Quality | Operational indicators - visit completion and no-shows, documentation timeliness, clean claims, authorization lapses. Not CMS eCQM, HEDIS or MIPS measures. |
| Benchmarks | Your rates against your own prior period and the same period a year ago. An external benchmark appears only when it names its source; no peer ranking. |
| Forecast | Cash expected from today's A/R at 30, 60 and 90 days, from your own collection history, with its basis stated and no confidence range. |
| Outcomes | Outcome-measure administrations and comparable pairs. No change in score is reported until outcome measures are published. |
The Denials screen ends with Today's denial brief (AI summary of the figures above): a few sentences written by the AI from counts and amounts only, with those figures listed beneath it. A brief that states any figure not in that list is withheld. See AI drafts.